Building intuitive observability into orchestrated workflows

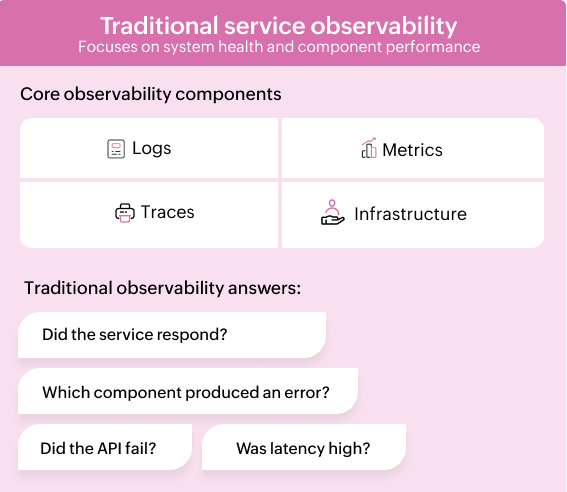
Traditional observability tools were built to answer infrastructure and application questions: Is the service healthy? Did latency spike? Which request failed? Those questions still matter, but they're not quite enough for orchestrated workflows.
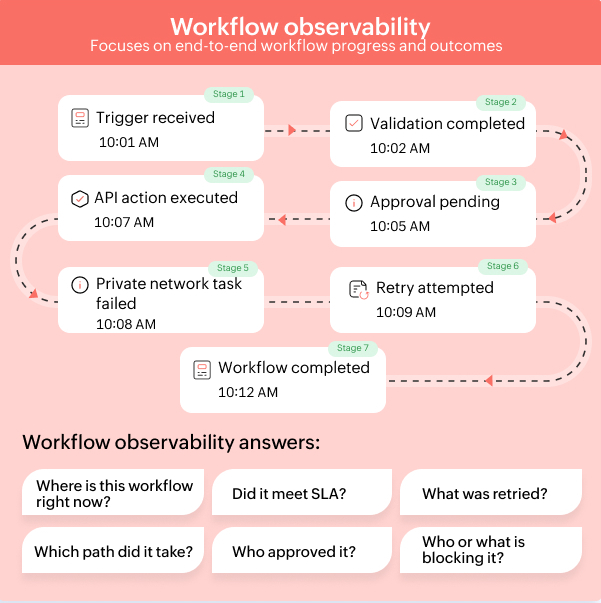
A workflow doesn't fail just because an API call failed. It can stall because an approval is pending, a stage deadline was missed, a private network task is unreachable, a retry policy was not defined, or a downstream system returned data the next step couldn't process.
That changes the observability model. For orchestrated systems, teams need to know where every workflow instance is, who or what it's waiting on, whether it's still within the SLA, what path it took, what payloads were exchanged, and what happened before failure.
In other words, orchestration observability isn't just about logs, metrics, and traces. It's about workflow state, execution context, approvals, timelines, and auditability in one view.
Why traditional observability breaks down
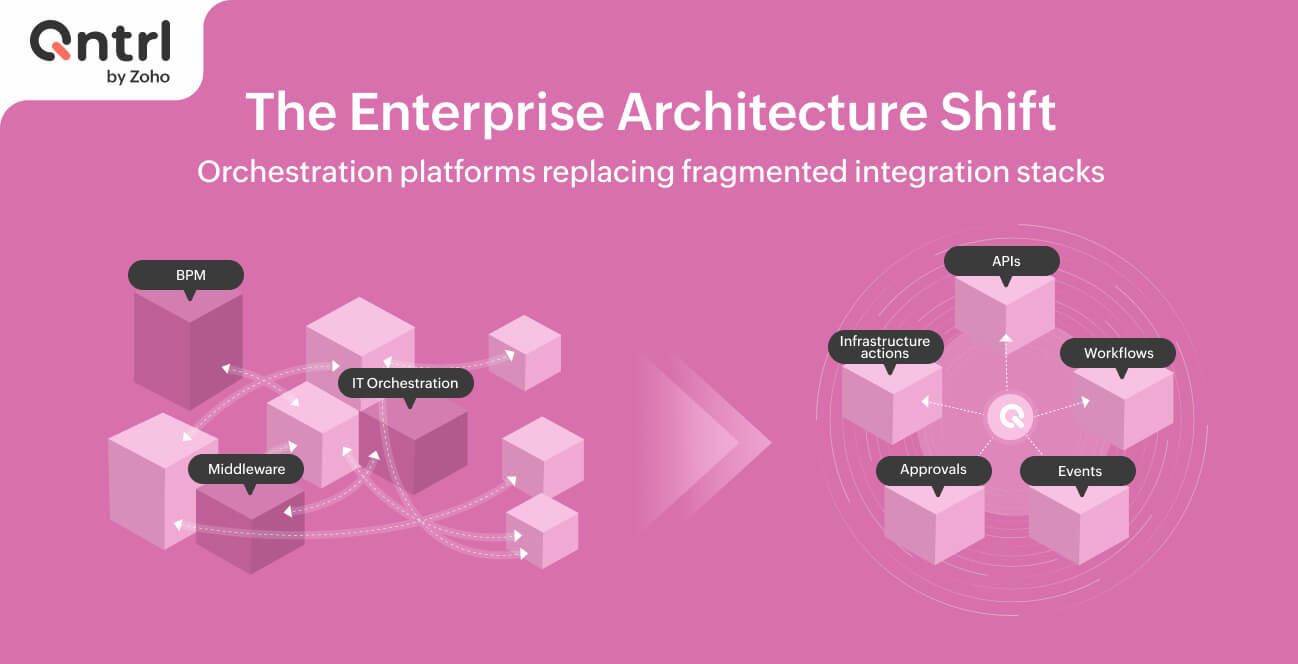
Traditional observability tools are useful for service health, application performance, infrastructure metrics, log search, and request tracing. They're less useful when the system being observed isn't a single service but a workflow that spans people, systems, approvals, APIs, databases, notifications, and private network actions.
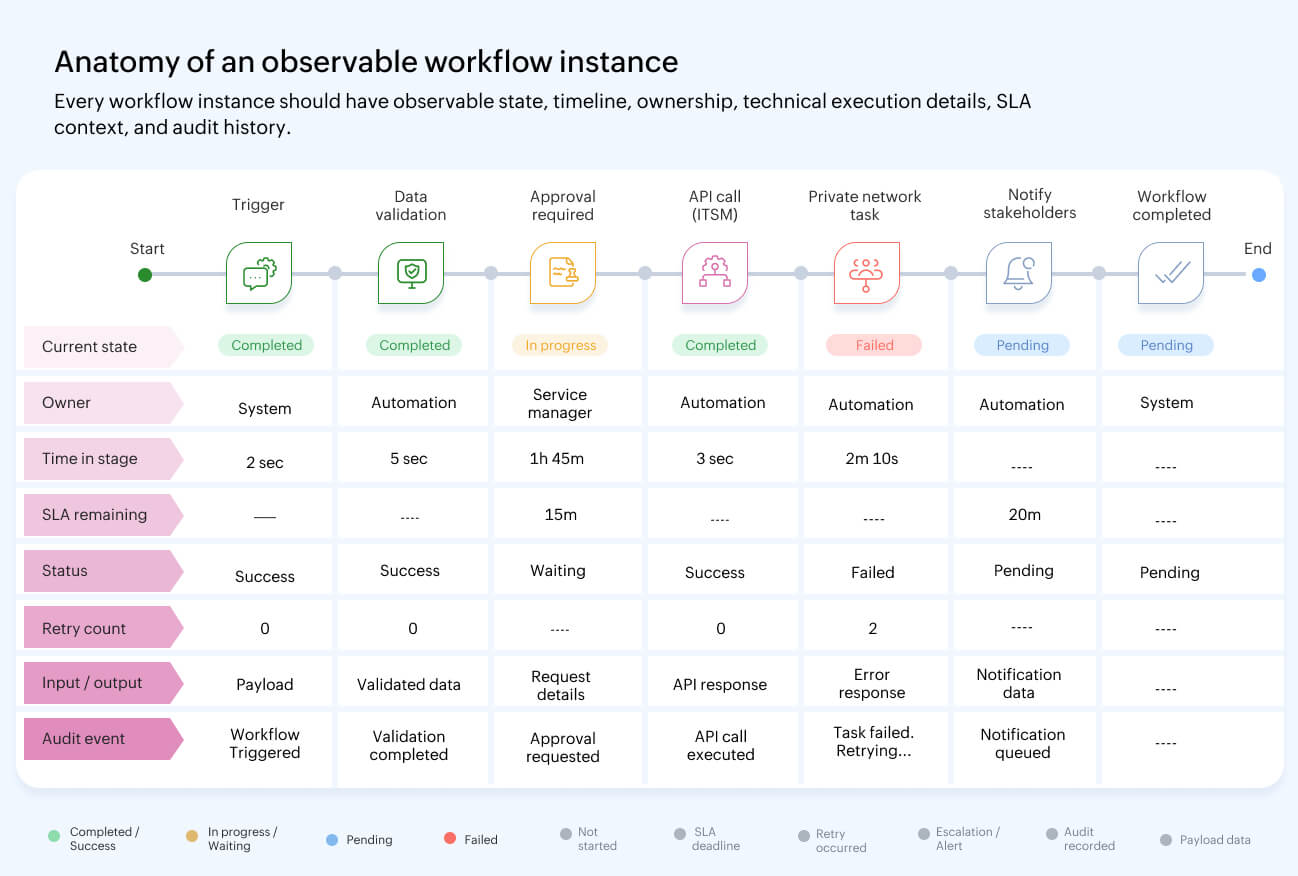
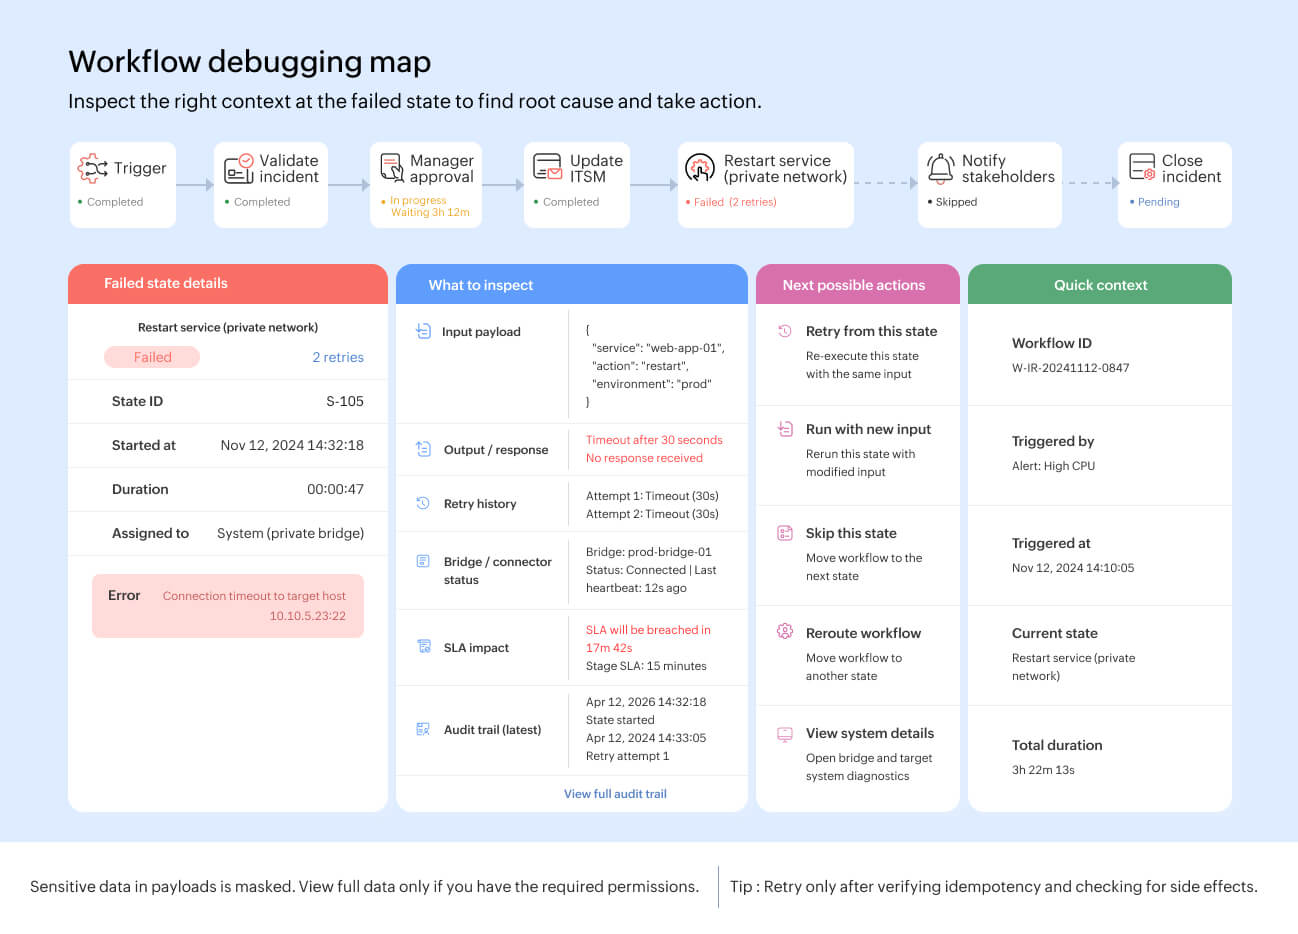
A typical incident response workflow might include:
- An alert that creates a workflow request
- A validation step that checks incident severity
- A manager or service owner's approval
- An API call to update an ITSM record
- A private network task that restarts a service
- A notification to stakeholders
- A final closure step with the audit history
Traditional observability may show that an API responded in 200 milliseconds or that a job completed successfully. It may not show that the workflow sat in approval for three hours, missed a stage deadline, retried a failed task twice, or took a fallback path because the primary private network task failed.
That's the core gap. Service observability tells you how components behaved. Orchestration observability tells you how the process moved, where it stopped, and what business or operational consequence followed.
What orchestration observability requires
A workflow orchestration platform needs visibility at the workflow-instance level, not only at the system-event level.
The minimum requirements are:
- Real-time workflow state visibility: Teams should be able to see active, pending, failed, completed, and delayed workflow instances without reconstructing status from raw logs.
- Stage and transition visibility: Each workflow should expose the current stage, previous stages, available transitions, owners, and conditions that determine the next step.
- Approval and gate visibility: Approval steps must be observable as first-class workflow events, including assignee, decision, timestamp, comments, and time spent waiting.
- SLA tracking: Stage deadlines should support practical business rules like minutes, work hours, work days, weeks, date fields, conditional deadlines, reminders, due date alerts, and escalations.
- Execution history: Technical teams need execution status, start time, end time, duration, input, output, exception details, retry attempts, and the exact state where a workflow failed.
- Audit trails: Governance teams need user actions and automated events captured with enough context to review changes, detect unusual activity, and backtrack decisions.
- Operational reports: Reports should show stage duration, stage utilization, blueprint or process usage, workload distribution, and average completion time.
The key shift is simple: Logging isn't the same as visibility. A log can tell you that something happened. A workflow state model tells you what's happening now, what should happen next, and what happens if the next step is delayed. Operational performance is better when measured with recovery time, failure rate, and delivery metrics.
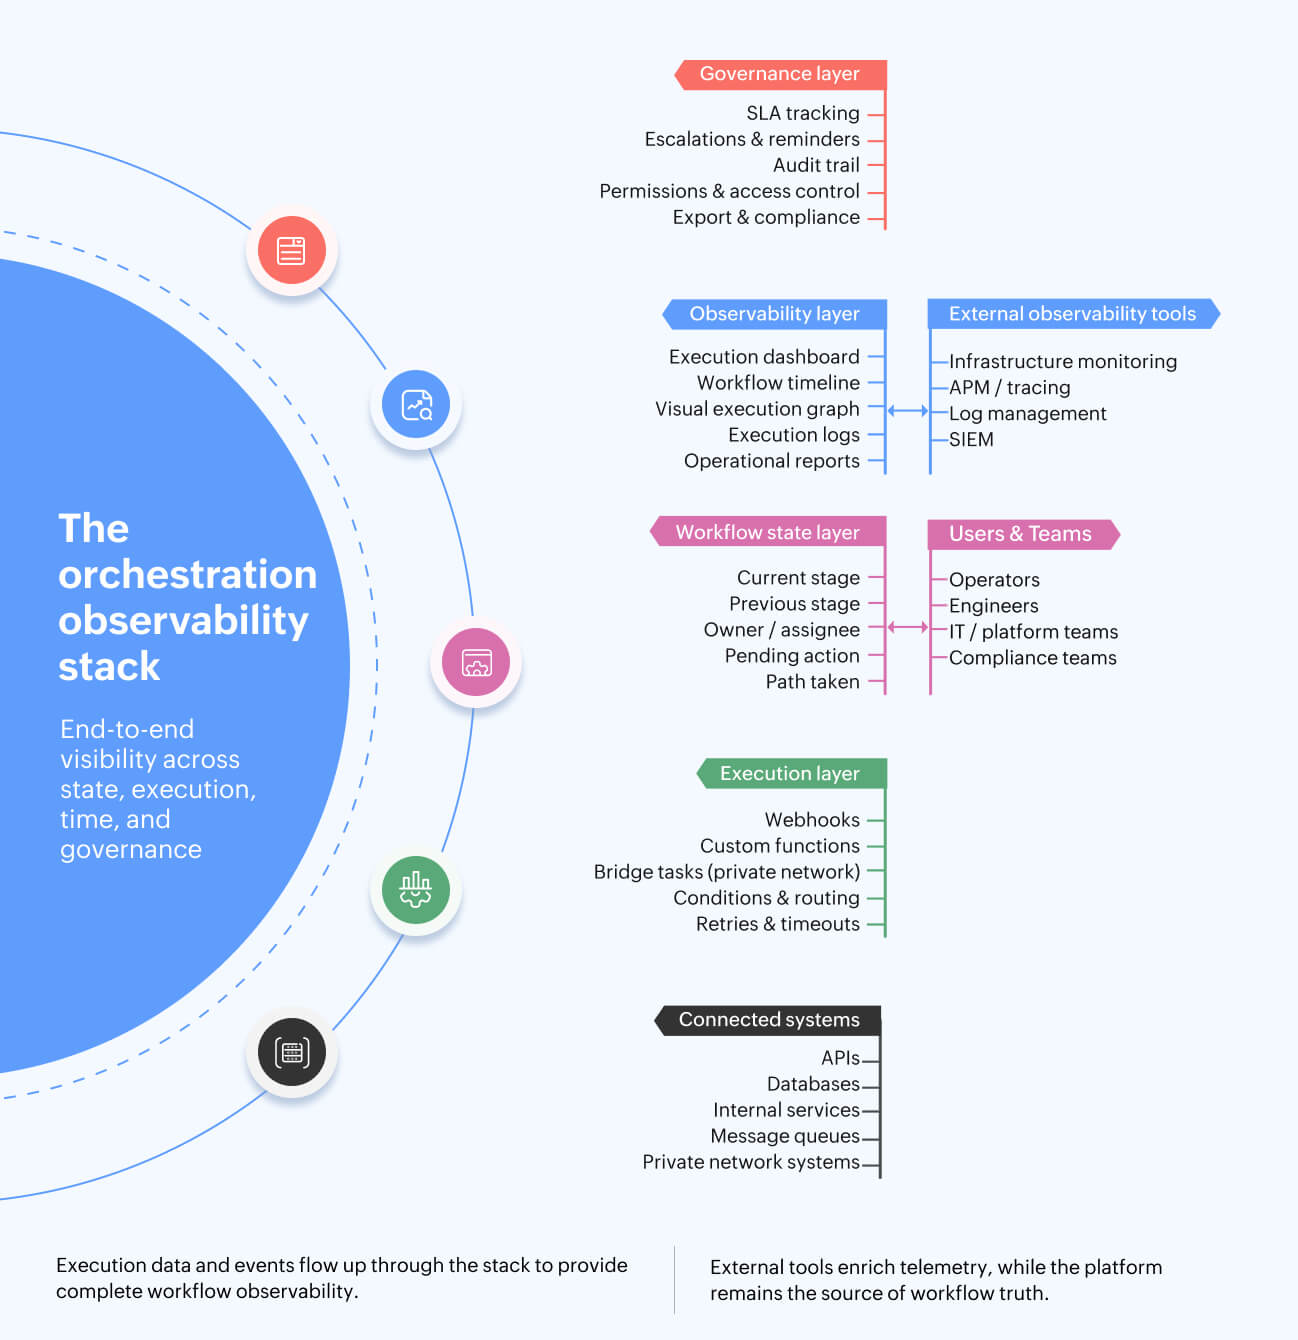
The architecture of orchestration observability
Strong orchestration observability depends on a few architectural building blocks.
- Workflow state engine: Every workflow instance should move through named stages, transitions, and states. This makes each step queryable and visible, rather than buried in application logs.
- Execution dashboard: Teams need a consolidated view of total executions, successful executions, failed executions, running executions, recent executions, and usage trends.
- Visual execution graph: For technical workflows, a graph view helps teams inspect which state ran, which path was traversed, how long each state took, and where the failure occurred.
- Execution logs: Logs should show state-level events, timestamps, payloads, parameters, responses, and error details. For debugging, teams should be able to retry failed executions or run a workflow again with new input.
- SLA and escalation layer: Deadlines, reminders, due date alerts, and escalations should be defined at the stage level. This keeps time-based accountability close to the workflow design.
- Audit layer: User actions, automated actions, and configuration changes should be reviewable by authorized users, with filtering and export options where required.
- Private network observability: If workflows execute tasks inside a private network, teams need visibility into bridge connectivity, failed jobs, and resource thresholds like CPU, memory, and disk usage, where monitoring is enabled.
Technical pain points to touch during implementation
- Define a consistent identifier strategy. At minimum, capture workflow ID, request or card ID, execution ID, and external system reference IDs.
- Use clear state names. Avoid generic names such as “Step 1” or “Process data.” State names should explain the action being performed.
- Capture timestamps for every state entry, state exit, approval, retry, escalation, and completion.
- Treat payload visibility carefully. Mask secrets, credentials, tokens, personal data, and regulated fields in logs and reports.
- Use role-based access for reports, audit logs, execution details, and payloads. Not every workflow participant should see every technical detail.
- Configure retry, timeout, and fallback behavior explicitly. A failed API call and a delayed approval need different handling.
- Test webhooks, custom functions, private network tasks, and authentication before publishing workflows.
- Prefer OAuth 2.0 for API authentication when available. If API keys are used, restrict access and rotate them periodically.
- For private network execution, document firewall requirements, bridge ownership, credential handling, and bridge health monitoring.
Implementation patterns
There are three practical patterns for observing orchestrated workflows:
- Embedded observability: The orchestration platform provides workflow state, dashboards, execution logs, reports, SLAs, audit logs, and debugging views inside the same runtime. This reduces integration work and gives teams one place to understand workflow status.
- External observability only: The orchestration platform transmits events to external monitoring tools, and teams build their own dashboards. This can work for infrastructure metrics, but it often misses workflow-native concepts like approvals, stage deadlines, and business-state transitions.
- Hybrid observability: The orchestration platform remains the source of truth for workflow state, approvals, SLAs, execution history, and audit trails. External observability tools are used for deeper infrastructure and application telemetry. This is usually the most practical model for enterprises.
The important design decision is ownership: The orchestration platform should own workflow visibility. External tools can enrich that visibility, but they shouldn't be required to reconstruct basic workflow state.
Wrapping up
Observability isn't optional for orchestration platforms. As workflows span more systems, teams, approvals, and private network actions, visibility must move from service-level monitoring to workflow-level understanding.
The right observability model should answer practical questions immediately: Where's the workflow now? Who's it waiting on? Did it meet the SLA? What path did it take? What failed? What was retried? Who approved it? What changed?
Logs, metrics, and traces still matter, but they're only part of the picture. For orchestrated systems, the workflow runtime must provide state, timeline, execution history, approvals, SLA visibility, and audit context as native capabilities.
Build workflow-level observability into every stage of execution with Qntrl, or sign up for a personalized demo to see how governed orchestration works across systems, approvals, SLAs, and execution logs.
Enjoying your reading?
Enjoy organization and visibility too!
Qntrl can help you organise, control and improve production and projects in your team.